Graph source:
Processing sketch folder
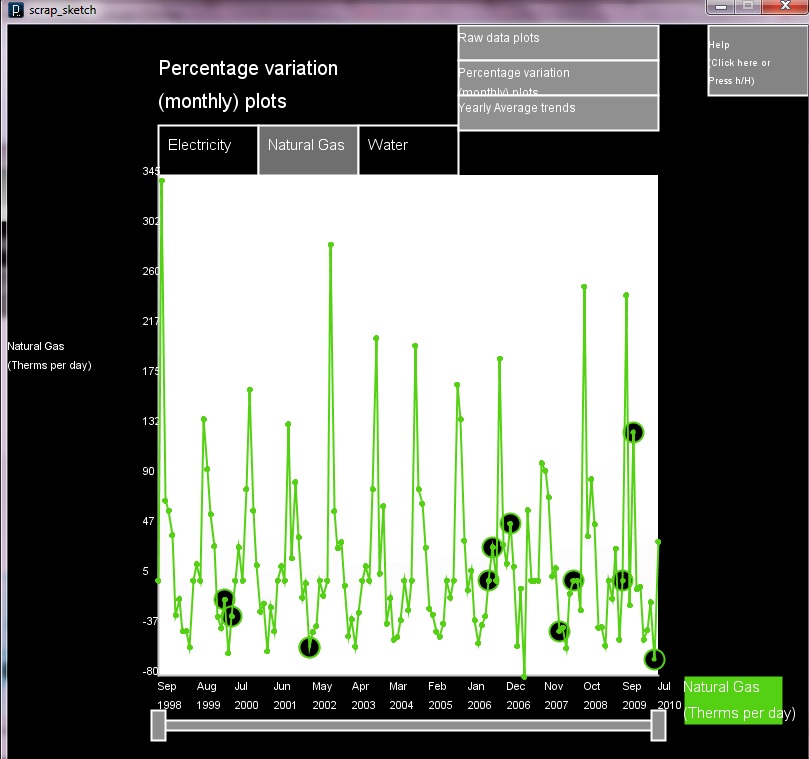
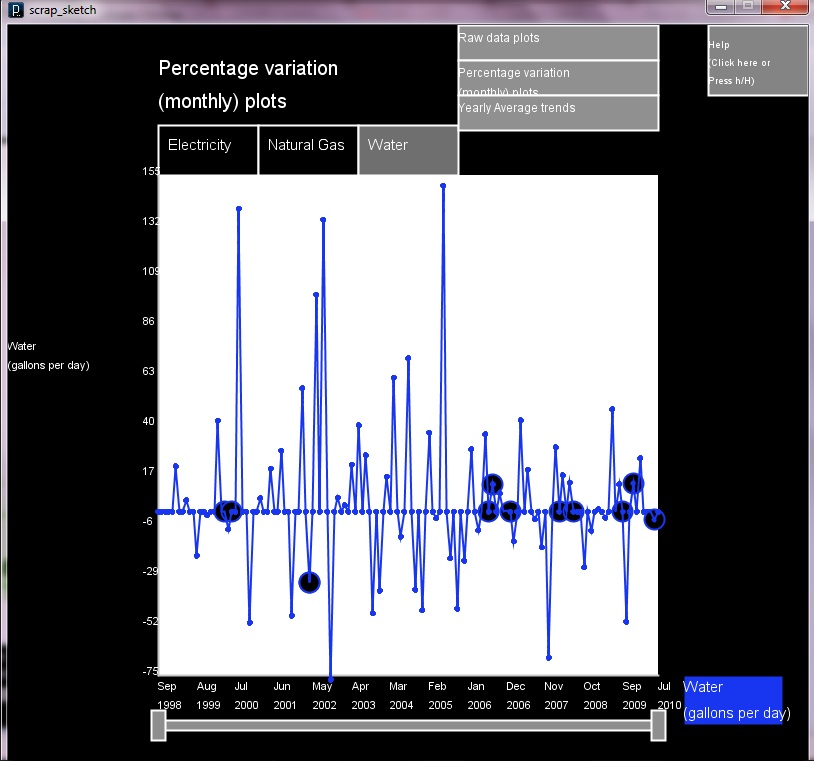
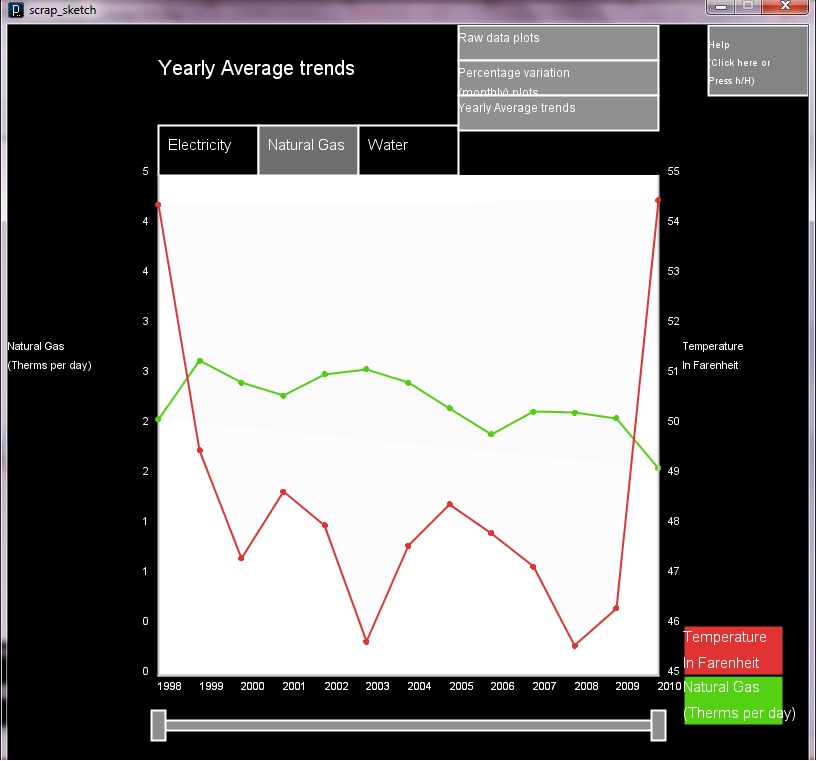
Graph Features:
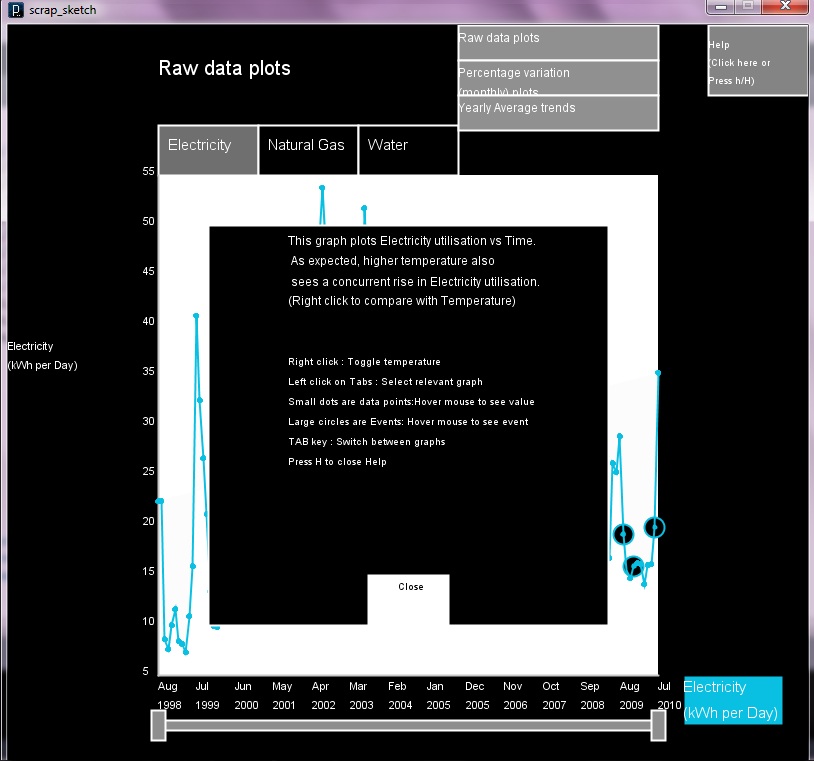
- Raw data plots, Monthly variations, Yearly averages
- Toggle temperature overlay for camparison
- Data/Event highlights
- Zoom into the graph dynamically
- Context-sensitive help :)
Screenshots:
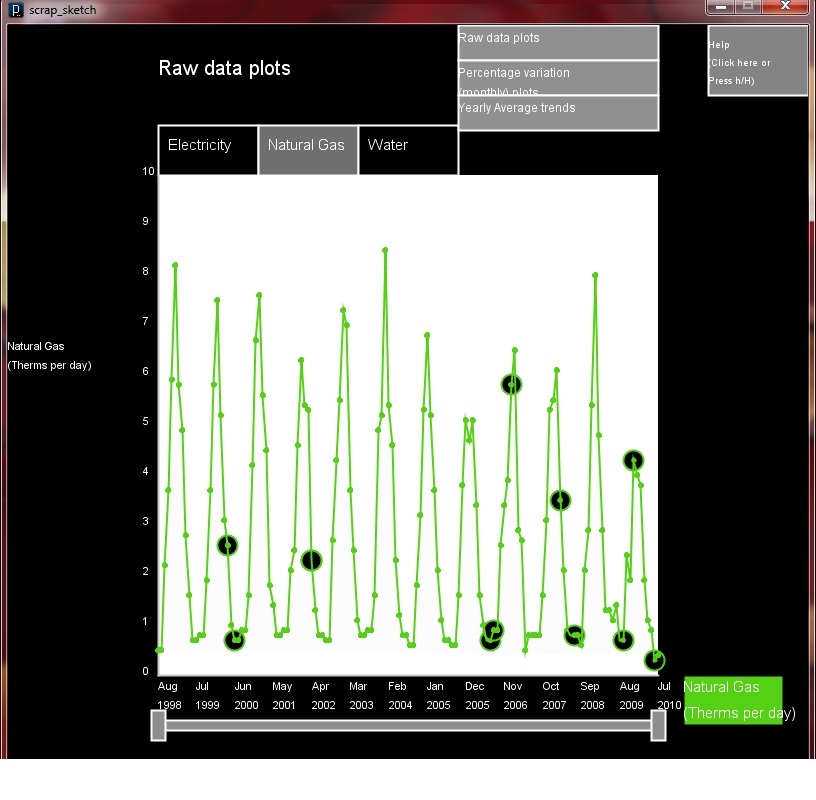
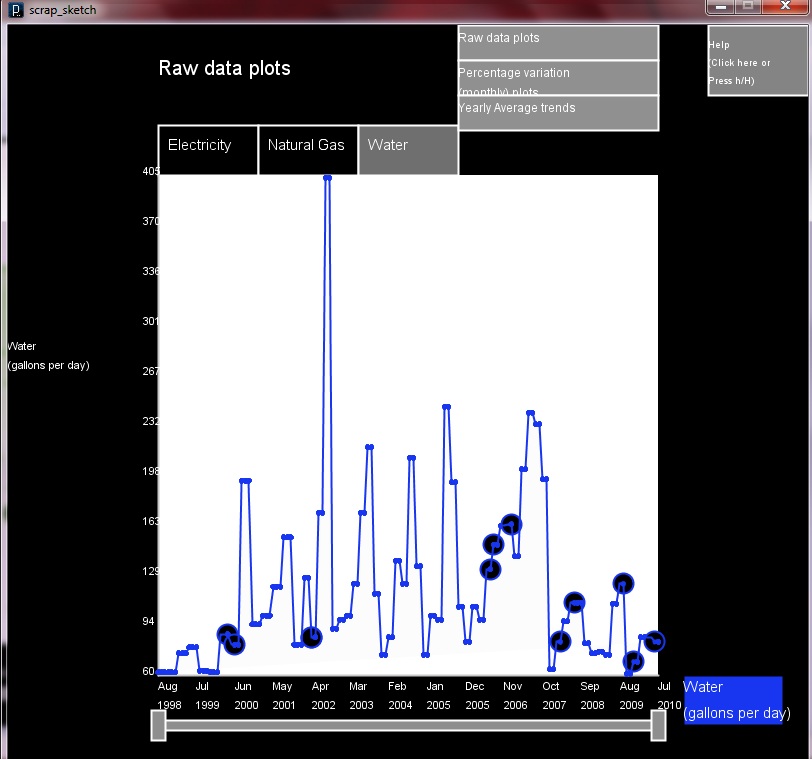
| Graph | Electricity | Gas | Water |
|---|---|---|---|
| Raw plots | 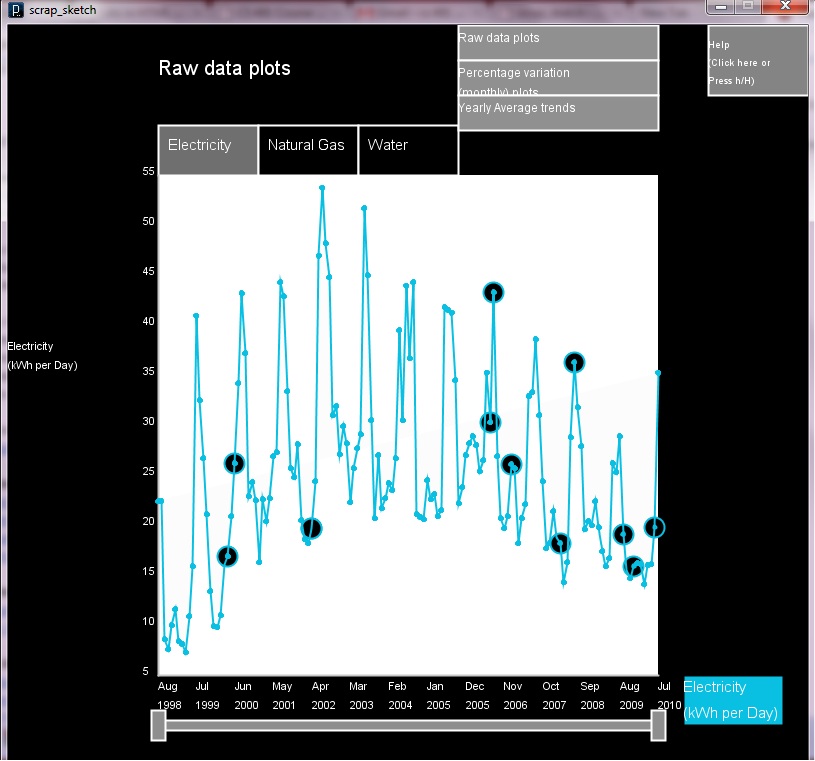 |
 |
 |
| Percent change plots | 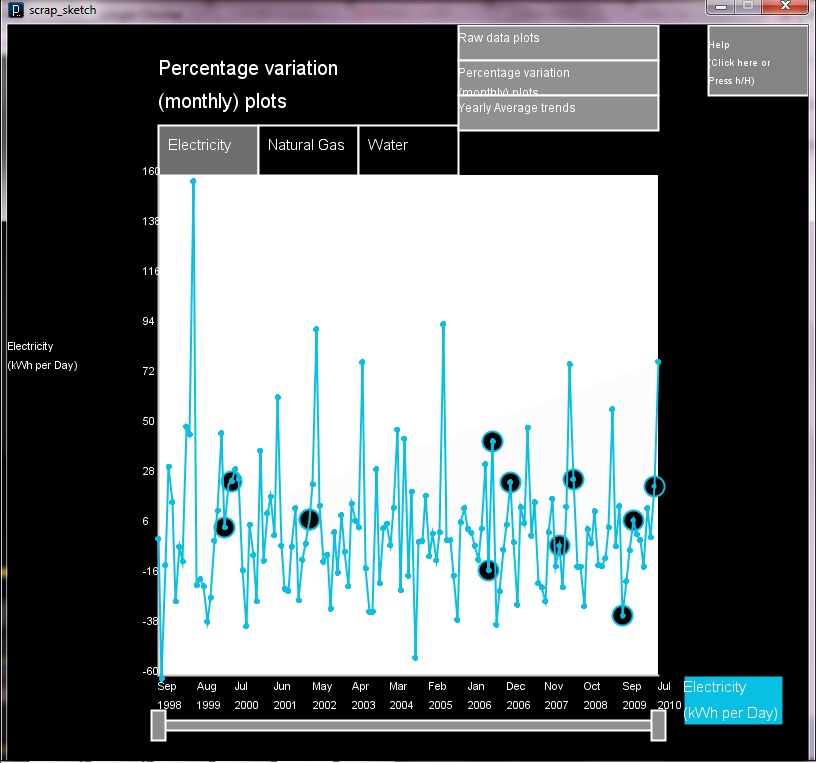 |
 |
 |
| Yearly average plots | 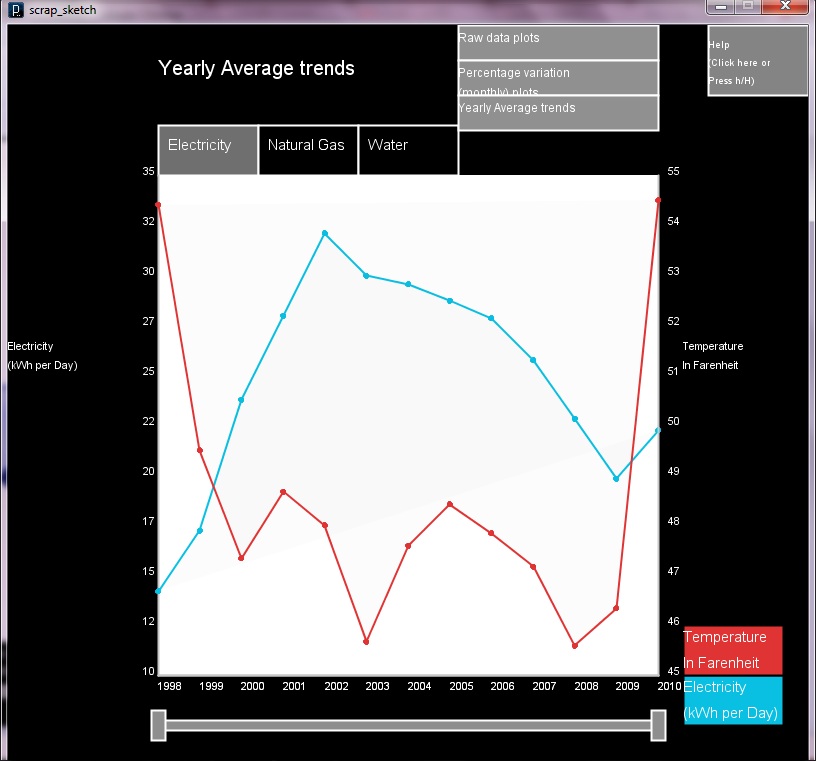 |
 |
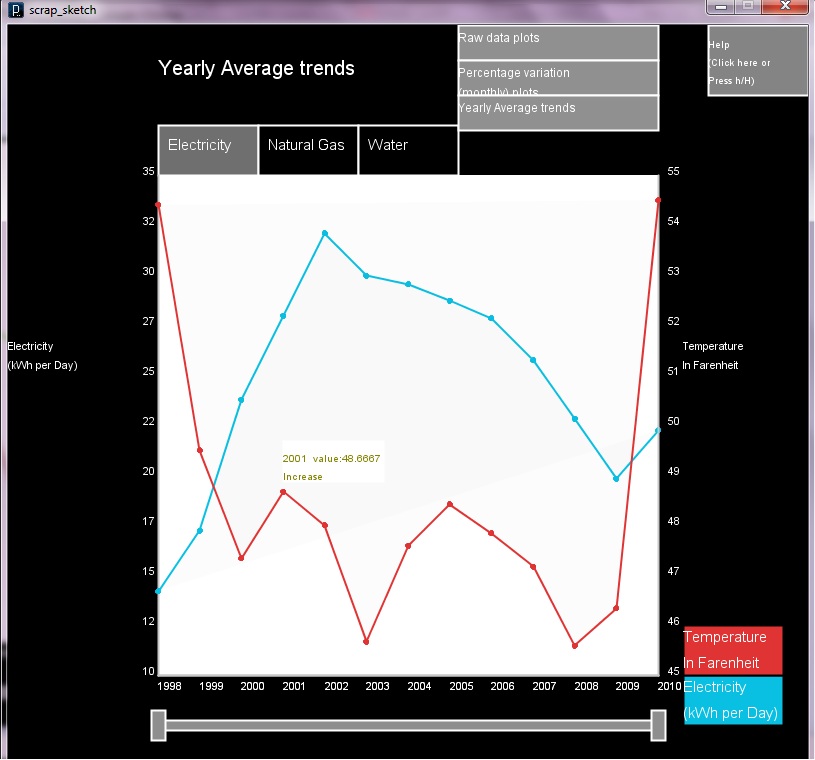 |
Tooltip veiw:
CS491:Project 1
- Far more difficult than i expected
- Takes a lot of time, starting early is necessary(I am not making excuses...)
- Fun :)
Stuff i happened to notice:
- July, 1999: Sudden spurt in electricity usage, the airconditinoer sweating it out?
- March, 2007: Electricity utilisation decresed, despite shooting temperatures:-/
- Maybe August 2002 was when the fish were infected?
- June 2010, probably left something running when leaving out of town?
Built with Processing